DrinkLens: An Automated Online Auditing Tool for Alcohol Products
DrinkLens: An Automated Online Auditing Tool for Alcohol Products
Author: Dunyu Yang
Company Name: Auckland ICT Graduate School
Company Mentor: Natalie Walker
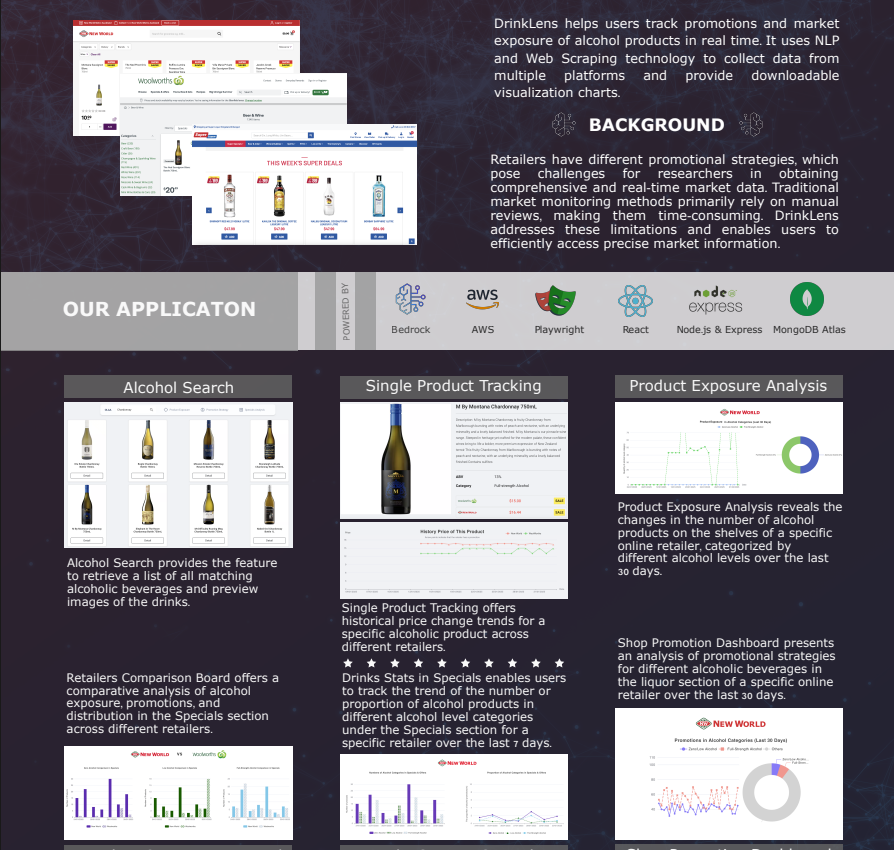
Abstract—Alcohol abuse is a significant public health concern in New Zealand, contributing to high social and economic costs. While various interventions exist, there is a notable lack of efficient tools to audit the marketing of alcohol products. This report introduces DrinkLens, an automated online auditing tool developed to bridge this gap. DrinkLens leverages cutting-edge technologies such as natural language processing and data engineering to analyze the marketing trends of alcohol products across different retailers. The system enables academic researchers to track promotional practices, assess alcohol content categorization, and compare the marketing exposure of zero alcohol, low alcohol, and full-strength alcohol products. DrinkLens provides valuable data-driven insights through an intuitive dashboard, facilitating the regulation and better understanding of alcohol product marketing.
Index Terms—Public Health, Digital Health, Academic Researcher, Alcohol Auditing, Automated Tools, Software Engineering, Data Engineering, Data Science, Optical Character Recognition, Nature Language Processing, Cloud Service.
I. INTRODUCTION
New Zealand's healthcare system is facing critical challenges, with alcohol abuse being a major contributing factor. In 2000, alcohol consumption accounted for approximately 3.9% of all deaths (around 1,037 individuals). While moderate alcohol consumption may offer cardiovascular benefits for older adults, the burden of alcohol-related injuries and fatalities is particularly severe among younger populations [1]. Moreover, a 2009 study estimated that harmful drinking costs New Zealand's society NZD 5.3 billion annually—nearly equivalent to the agricultural sector's contribution to GDP (NZD 6.7 billion) [2].
Considering these challenges, New Zealand's government, research institutions, and related organizations are exploring the potential of leveraging information technology to address alcohol-related social and health issues. Smartphone applications, for instance, provide personalized and immediate intervention solutions for alcohol use problems. The Alcohol Comprehensive Health Enhancement Support System (A-CHESS) uses a mobile platform to offer real-time support and feedback, helping users reduce dependency on alcohol and prevent relapse [3]. With personalized data and real-time reminders, it offers long-term support for health management. New Zealand's web-based alcohol screening and brief intervention program (e-SBI) has also demonstrated remarkable success among university students. Research shows that just 10 minutes of online intervention can significantly reduce alcohol consumption among young people, with effects lasting over six months [4]. These findings underscore the efficiency of software tools as a means of alcohol-related health intervention. However, despite these advances, there remains a gap in efficient and user-friendly tools to audit the marketing of alcohol products, due to the highly specialized nature of such tasks.
To address this gap, during the Summer Health Challenge hosted by Auckland ICT Graduate School, my team XPAD developed an automated Online Zero & Low Alcohol Auditor called DrinkLens. Designed specifically for academic researchers, DrinkLens integrates automated data collection and analysis with an intuitive dashboard that features graphs and charts, leveraging modern user interface(UI) design and incorporating natural language processing (NLP) capabilities. The system combines software and data engineering to provide users with clear, data-driven insights, enabling a comprehensive evaluation of retailers' alcohol marketing strategies and trends in promoting alcohol products.
II. PROGRAMME BACKGROUND
With the continuous advancement of medical technology, digital healthcare is receiving increasing attention and has become a crucial solution for improving healthcare accessibility, enhancing service efficiency, and reducing costs. Research has shown that telemedicine, as a knowledge-based health service technology, not only provides continuous, high-quality, and timely medical care to patients in remote areas but also effectively reduces medical costs by shortening hospital stays and improving chronic disease management [5]. Moreover, mobile health (m-health) technologies have demonstrated significant potential. For instance, Mirza's research explores the application of mobile devices in New Zealand's healthcare system. The findings reveal that mobile technologies, through real-time access to clinical data, medication reminders, and patient management tools, can significantly enhance healthcare efficiency while improving patient safety and treatment adherence [6].
Recognizing the potential of digital healthcare, various sectors in New Zealand have taken proactive measures. Since 2013, the National Health IT Board has been actively promoting the development of shared health records and has launched grassroots training and education programs to cultivate professionals in health IT [7]. Additionally, Dobbie and Ross initiated the Precision Driven Health Research Partnership, which aims to integrate resources from the New Zealand government, private enterprises, medical institutions, and universities to develop precision health solutions based on big data and personalized medicine [8].
III. PROJECT DESCRIPTION
A. Project Background
Alcohol consumption remains a major public health issue in New Zealand, contributing to a significant number of healthrelated problems, injuries, and fatalities. Despite various public health initiatives aimed at curbing alcohol abuse, there is a clear need for innovative and effective technological solutions to monitor and regulate the marketing of alcohol products. In response to this challenge, the DrinkLens project emerged as a solution to streamline the process of auditing alcohol product marketing.
DrinkLens is designed to be a user-friendly and efficient auditing tool for academic researchers and public health professionals. Through automated data collection and advanced analytics, DrinkLens aims to categorize alcohol products based on alcohol by volume (ABV) and analyze their marketing strategies. By focusing on online retail platforms like Woolworths and New World, DrinkLens provides insights into the visibility and promotional practices of zero alcohol, low alcohol, and full-strength alcohol drinks. Through this initiative, the tool strives to encourage the promotion of healthier drinking alternatives and support public health policies in New Zealand.
Accurately categorizing alcoholic drinks in online retailers based on their ABV and analyzing their marketing strategies is at the core of DrinkLens' work. ABV is a standardized measurement that expresses the alcoholic content of a drink, and represents the percentage of ethanol (pure alcohol) in a given volume of liquid. The higher the ABV, the stronger the alcoholic drink. According to the Summer Health Challenge project topic requirement, alcoholic drinks are classified into three categories according to their ABV content: zero alcohol, which includes drinks with an ABV of 0.5 per cent or less; low alcohol, which is defined as drinks with an ABV between 0.5 percent and 1.15 percent; and full-strength alcohol, which includes drinks with an ABV of more than 1.15 per cent.
Throughout the entire DrinkLens project carried out by my team, we received invaluable guidance from our industry mentor Professor Natalie Walker, who offered practical advice from the public health domain to ensure our design effectively addressed real-world application needs.
B. Project Goals
The business objective of DrinkLens is to optimize the promotion of zero and low alcohol products, regulate related marketing practices, enhance the market competitiveness and consumer acceptance of such alternatives, and ultimately drive the adoption of these products. By promoting low- and noalcohol substitutes, DrinkLens aims to reduce the health risks associated with high alcohol consumption and foster a healthier drinking culture in New Zealand.
In the tech aspect, accurately categorizing alcoholic drinks based on their ABV and analyzing marketing trends and exposure of zero, low and full-strength alcohol products in online retailers is at the core of DrinkLens' work. In the DrinkLens project, we employed User Stories as the primary methodology for conducting requirements analysis. User Story is a classic tool for goal management and is used to succinctly describe user needs. Focusing on the user's perspective and value objectives, User Story uses non-technical language to define the tasks or goals that the user wants to achieve with the software tool. The advantage of this approach is that it helps the development team quickly and accurately understand the project goals and facilitates effective communication with stakeholders.
Each User Story is typically represented in the following format:
"As a [role], I want [goal], so that [value]."
Examples of User Stories from the DrinkLens project include the following:
User Story 1: As an Academic Researcher, I want to check the total quantity and percentage of each alcohol level category (zero/low alcohol and full-strength alcohol) displayed on the first page of alcohol product section on the Woolworths and New World websites, so that I can evaluate whether these retail platforms prioritize exposure for zero/low alcohol products.
User Story 2: As an Academic Researcher, I want to track changes in the proportion of discounted alcohol within a specific alcohol level category (zero/low alcohol or full-strength alcohol) relative to the total quantity of both alcohol level categories on the New World and Woolworths websites over a period of time, so that I can check if two retailers encourage the consumers purchasing the healthier alcohol products.
User Story 3: As an Academic Researcher, I want to see the quantity and proportion of two alcohol level categories (zero/low alcohol and full-strength alcohol) on the specials section of the Woolworths and New World websites, so that I can assess their visibility and ensure balanced promotional practices.
This approach enabled me to define and manage user requirements, providing a well-defined target for subsequent development efforts.
C. Project Milestones
For better achievement of project goals, DrinkLens' work was organized into four project milestones. In the milestone planning process, the Scrum agile methodology was adopted with a sprint mindset combined with the Minimal Viable Product (MVP) concept.
Scrum is an agile development approach [10] —a variant of the Software Development Life Cycle (SDLC) —that emphasizes iterative development and incremental delivery. Through short, multiple sprint cycles, functionalities were delivered step by step and the system was continuously optimized based on feedback from target users. Compared to traditional Big Upfront Design (BDUF) methods like the Waterfall model, Agile development enabled adjustments at any stage in response to new requirements or feedback, significantly improving development efficiency [11]. Given the tight schedule, Agile development was selected as my preferred approach. The iterative nature of Agile allowed for the rapid delivery of functional outputs, with each phase incorporating clear deliverables and review checkpoints. This approach facilitated prompt issue resolution and the accumulation of valuable experience for subsequent stages. Moreover, Agile's emphasis on transparent communication and cross-functional collaboration aligned well with our flat team structure, making it an ideal choice.
The MVP concept is a highly effective product development philosophy where the core goal is to quickly launch a product with core function at minimal cost to obtain real user feedback, validate market needs, and guide subsequent product iterations and optimizations. For DrinkLens, the key to the MVP stage was to get an integrated basic release out as quickly as possible to ensure that the product provided valuable data insights for auditors. In the Viable Product (VP) stage, DrinkLens gradually expanded the functionality based on early user feedback and optimized the user experience to improve the product's usefulness and ease of use. Entering the Final Product (FP) stage, DrinkLens' focus shifted to fine-tuning the product and optimizing the existing functions.
IV. PROJECT MANAGEMENT PRACTICE
The role assignments for the DrinkLens project reflect the practice of the Scrum agile development framework. The Scrum Master and Back-end Developer, was responsible for driving agile processes, coordinating team workflows, designing the technical architecture and database, and ensuring system stability and efficiency. The Product Owner (PO) and Front-end Developer, was responsible for defining the product vision and priorities, managing the Product Backlog, and maintaining communication with the team and relevant stakeholders. The UI/UX Designer and Front-end Developer, focused on creating intuitive user interfaces and enhancing the overall user experience. The Data Engineer and Devops was responsible for data processing, backend development, and system deployment.
| USER STORY | STAGE |
|---|---|
| As an Academic Researcher, I want to check the total quantity and percentage of each alcohol level category (zero/low alcohol and full-strength alcohol) displayed on the first page of the alcohol product section on the Woolworths and New World websites, so that I can evaluate whether these retail platforms prioritize exposure for zero/low-alcohol products. | Minimum Viable Product |
| As an Academic Researcher, I want to track changes in the proportion of discounted alcohol within a specific alcohol level category (zero/low-alcohol or full-strength alcohol) relative to the total quantity of both alcohol level categories on the New World and Woolworths websites over a period of time, so that I can check if two retailers encourage consumers to purchase the healthier alcohol products. | Minimum Viable Product |
| As an Academic Researcher, I want to see the quantity and proportion of two alcohol level categories (zero/low alcohol and full-strength alcohol) on the “Specials” section of the Woolworths and New World websites, so that I can assess their visibility and ensure balanced promotional practices. | Minimum Viable Product |
| As an Academic Researcher, I want to visually review the price and promotion status of a specific alcoholic product at Woolworths or New World across different retailers, so that I can compare the pricing and promotional strategies for that product across retailers. | Viable Product |
| As an Academic Researcher, I would like to see alcohol content information (e.g., the labeled %ABV value) when searching for a specific alcohol product so that I can quickly identify whether the alcohol product is zero/low alcohol or full-strength alcohol. | Viable Product |
| As an Academic Researcher, I want to see a clear and informative homepage, so that I can quickly understand the system’s purpose, view key analytics data, and easily navigate to relevant sections. | Viable Product |
| As an Academic Researcher, I want to search for a specific alcohol product by entering its keyword, so that I can quickly access relevant information about the product, such as its price, type, and availability. | Viable Product |
| As an Academic Researcher, I want to interact with a chatbot by entering keywords related to alcohol products, so that I can directly receive relevant results efficiently without navigating through the website. | Final Product |
Fig. 1. After extensive team discussions and valuable feedback from the mentor, a total of nine user stories were developed. This table presents these user stories along with their corresponding stage classifications, which indicate their implementation priority within the project development cycle.
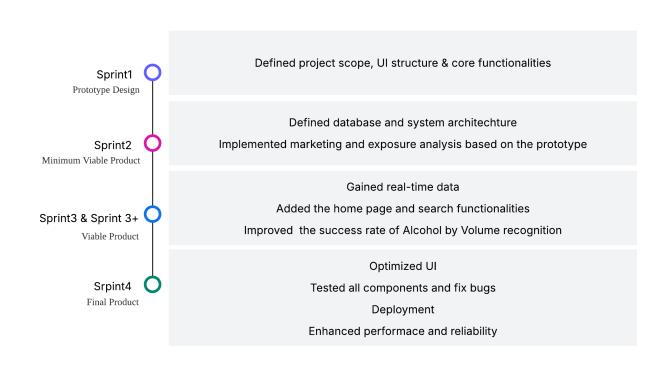
Fig. 2. By combining the Scrum methodology with the Minimal Viable Product concept, four project milestones were established, along with corresponding timelines, to ensure the efficient progression of the project and the timely delivery of key deliverables.
Although roles were clearly defined, we adopted a flexible management approach due to the limited time and team members, allowing team members to dynamically adjust responsibilities based on project needs. For example, during the initial stages of the project, the team primarily focused on project management, with all members contributing to planning, task breakdown, and resource coordination. As the development phase reached its peak, team members shifted their focus to coding and testing to ensure that the product was delivered on time and met user requirements.
Daily stand-up is another strong demonstration of my practice of the Scrum methodology, where team members report concisely on the current progress of their work in meetings to ensure synchronization of information. At the end of each sprint, the team holds a retrospective meeting to evaluate the current work methodology using the "start doing, stop doing, keep doing, do more, do less" framework. Through this process, the team is able to identify improvement points, make practical suggestions for optimization, and develop a better plan for the next sprint.
To achieve more efficient team collaboration, our team utilized tools such as GitHub, Confluence, and Kanban Board. GitHub, as a platform for code hosting, played a role in version control and branch management. DrinkLens possessed variant branches, allowing parallel development, reducing conflicts, and ensuring stable code merging. Confluence acted as the team's knowledge base, storing software requirement specifications, project plans, system design documents, and meeting notes. The Kanban Board provided a clear visualization of task assignments and progress, using categories such as "To Do," "In Progress," "Under Review," and "Completed." Tasks were broken down into small cards to ensure real-time updates and transparent management. Furthermore, to maintain a focus on user needs, a "User Stories" column was added to the Kanban Board, serving as a constant reminder to make the team stay aligned with project goals throughout the design and development process.
V. PROJECT DESIGN, IMPLEMENTATION AND RESULT
A. Overall Architecture Design
The architecture design of DrinkLens is modular, dividing the system into three parts: the frontend, backend, and database, to enhance system maintainability.
DrinkLens is primarily cloud hosted through Amazon Web Services(AWS), a comprehensive and widely used cloud platform provided by Amazon that offers a range of cloud computing services such as compute power, storage, databases, machine learning, analytics, and more, enabling organizations to host and manage applications in the cloud without the need to rely on a physical hardware infrastructure. DrinkLens leverages a variety of AWS services, including AWS EC2 and
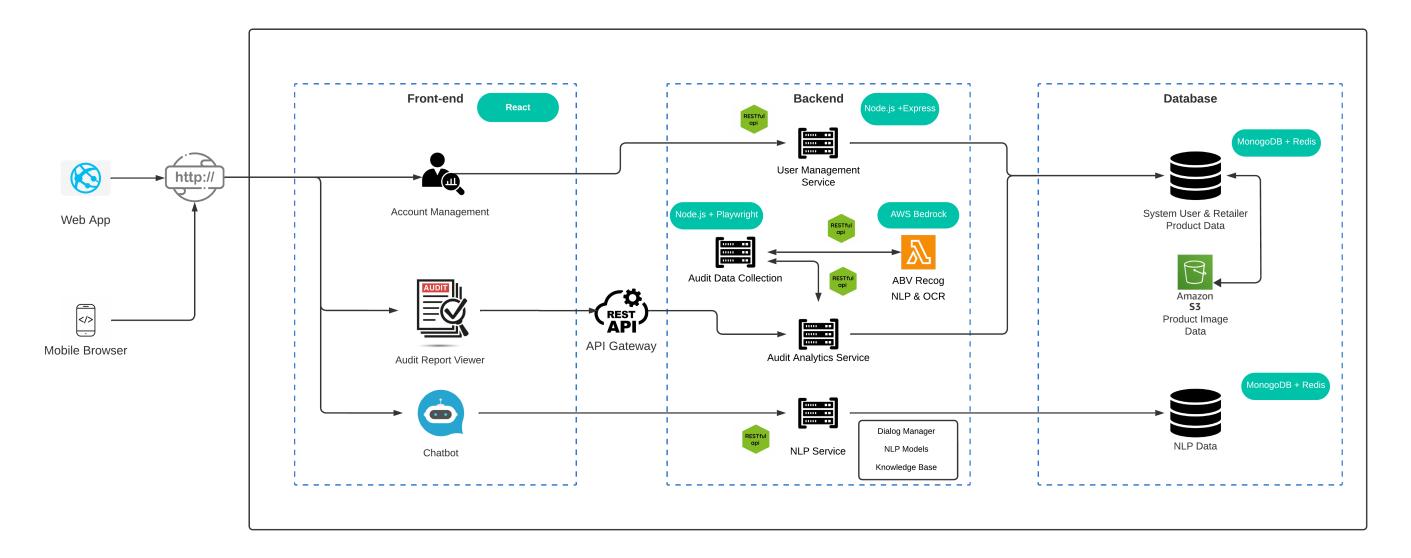
Fig. 3. This figure illustrates the system architecture of DrinkLens, highlighting the integration of various parts such as the frontend, backend, and database, along with cloud service component and their interactive workflow.
AWS Lambda. While other well-established cloud solutions, such as Microsoft Azure, were also considered, AWS's larger market share ultimately led to this decision. Early in 2020, AWS holds 41.5% of the IaaS market share, significantly surpassing Azure's 29.4%, with other competitors, including Google Cloud, having even smaller market shares [12]. A larger market share not only indicates broader application scenarios but also suggests greater future growth potential, making AWS a more valuable cloud platform to learn.
Drinklen's frontend is responsible for rendering the user interface and providing a responsive, user-friendly experience. Its key functionalities include account management, an audit report viewer, and a chatbot. The account management module supports user registration, login, and other account-related operations, while the audit report viewer helps users analyze data-driven insights, primarily presented in charts. The chatbot utilizes NLP to interact with users. The frontend communicates with the backend through standardized Application Programming Interfaces (APIs), with all requests transmitted via an API gateway.
Drinklen's backend serves as the core of the system, handling business logic, data access, storage, and interactions with the database. It comprises multiple functional modules, including user management services, audit data collection services, audit analysis services, and NLP services. The user management service manages user information and permissions, while the audit data collection service retrieves data from online retailer websites. The audit analysis service processes the collected data to generate analytical insights. The NLP service integrates conversation management, language models, and a knowledge base to facilitate intelligent user interactions. Additionally, the data collection service is integrated with AWS Bedrock, a pre-built generative AI tool to acquire relevant data, improving the accuracy and reliability of audit analysis results.
Drinklen's database employs a scalable storage solution to store user information, retailer details, alcohol product data, and other audit-related data. DrinkLens also utilizes Amazon S3 bucket to store image files, ensuring efficient access to image data. Additionally, in order to optimize backend responsiveness, DrinkLens integrates caching with persistent storage, enabling faster data retrieval.
When interacting with DrinkLens, users access the frontend through a web application or mobile browser. The frontend forwards user requests to the backend via a gateway. The backend processes these requests by invoking the appropriate service modules, interacting with the database, and returning the results to the frontend.
B. Database Design and implementation
The database design for DrinkLens was carried out in three steps. First, an Entity-Relationship (ER) diagram is created to define the entities, attributes, and their relationships in the system, resulting in an Entity-Relationship model. Second, the ER diagram is mapped to a database schema (DB Schema), in which the identified entities and relationships are converted to tables and fields in the database, and primary keys, foreign keys, and various constraints are defined to ensure data integrity and consistency. Finally, the DB Schema is converted into Data Definition Language (DDL) statements for SQL, which are used to generate the actual database table structures.
For database implementation, MongoDB was selected as the primary storage solution. Collections were created for each entity (e.g., products and retailers). Once the data structure was established, the database was populated with simulation data for integration testing.
The database was deployed to MongoDB Atlas during the project deployment stage. MongoDB Atlas, a free and userfriendly cloud-hosted database service provided by MongoDB, was chosen for its cost-effectiveness, convenience, and reliability.
C. UI Design and Frontend Implementation
For the UI design of DrinkLens, Figma was selected as the primary tool. Initially, Axure was considered for its robust capabilities in interactive design and functional prototyping. However, after evaluation, Figma proved to be the more suitable option due to existing team familiarity, enabling a quick start and minimizing additional learning costs. In contrast, Axure was relatively unfamiliar to some team members and presented a steep learning curve, which was not ideal given the tight project timeline.
For frontend development, the React.js framework was adopted, and its component-based design philosophy was applied by breaking the interface into independent component modules, such as the navigation bar and chatbot components, each dedicated to a specific function. In terms of styling and data visualization, Material-UI (MUI) and Chart.js were utilized to accelerate UI code implementation, ensuring standardized interface layouts and efficient data representation. Additionally, Hooks and Context API were applied to achieve state management, allowing global variables to be shared across components. This approach improved data transmission efficiency and eliminated the need for prop drilling, ensuring state consistency and maintainability throughout the application.
D. Backend Design and Implementation
In DrinkLens' backend architecture design, the Model-View-Controller (MVC) design pattern was adopted. Under this pattern, the Model was responsible for interacting with the database, the Controller handled client requests, processed logic, and returned the final results to the front end. Through this layered architecture, the code was modularized, ensuring decoupling between different functional modules and improving code reusability.
To improve the API response speed, Redis was introduced as the caching tool. It was used to cache backend API response data. The caching process worked as follows: when a client requested an API for the first time, the backend retrieved the data from the MongoDB database and stored the query result in Redis. For subsequent requests to the same API, the data was retrieved directly from Redis, eliminating the need to query the database again. This approach reduced database query load and significantly improved API response speed.Since the data collector updated the data only once a day, this caching strategy effectively improved query efficiency while ensuring data timeliness. To prevent outdated data and minimize unnecessary database queries, the Redis cache expiration time was set to 6 hours.
Additionally, to record the Drinklen's backend running status for troubleshooting and debugging, a log management system was implemented. Winston, a powerful logging library widely used in Node.js applications, was employed for logging purposes. Meanwhile, Chalk, a library for adding color and styles to command-line outputs, was used to highlight logs, making the output clearer and more intuitive. This logging system significantly enhanced the overall maintainability of DrinkLens.
E. Project Results
The DrinkLens project has successfully delivered a comprehensive alcohol market analysis tool, centered around three key dashboards that provide valuable insights into alcohol product distribution and promotion strategies across different retailers.
The Product Exposure Analysis dashboard effectively tracks and visualizes the proportion of zero-alcohol, low-alcohol, and full-strength alcohol products displayed on supermarket homepages. This feature enables users to assess whether retailers are actively promoting lower-alcohol alternatives, providing essential insights for market regulation and decision-making.
The Promotion Analysis dashboard focuses on analyzing the distribution of alcohol categories in promotional campaigns. By examining the prevalence of zero-alcohol, low-alcohol, and full-strength alcohol products in promotions, users can determine whether supermarkets prioritize certain alcohol types, offering a clear perspective on retailers' marketing strategies.
The Specials Analysis dashboard specifically monitors the "Specials" sections of Woolworths and New World websites. It tracks the proportion of different alcohol categories featured in promotional offers, allowing users to evaluate whether retailers maintain a balanced promotion strategy across different alcohol types, thereby preventing potential market bias.
Beyond charts in dashboards, DrinkLens has also introduced several practical features to enhance user experience and improve data accessibility. The Download Charts Locally function allows users to export and save analytical charts, facilitating offline use and report generation.
To improve user engagement, Homepage Enhancements have been implemented, featuring New Zealand Alcohol Market Insights, alcohol-related policies and regulations, team introductions, and contact information, ensuring that users can easily access relevant industry knowledge and support.
The Product Search and Product Details feature has significantly improved data querying efficiency. Users can now quickly search for specific alcohol products and access key details such as product description, product ABV, price, promotional status, and historical price trends. Additionally, the Price Comparison function enables users to analyze the price variations of the same product across different retailers, providing deeper insights into market fluctuations.
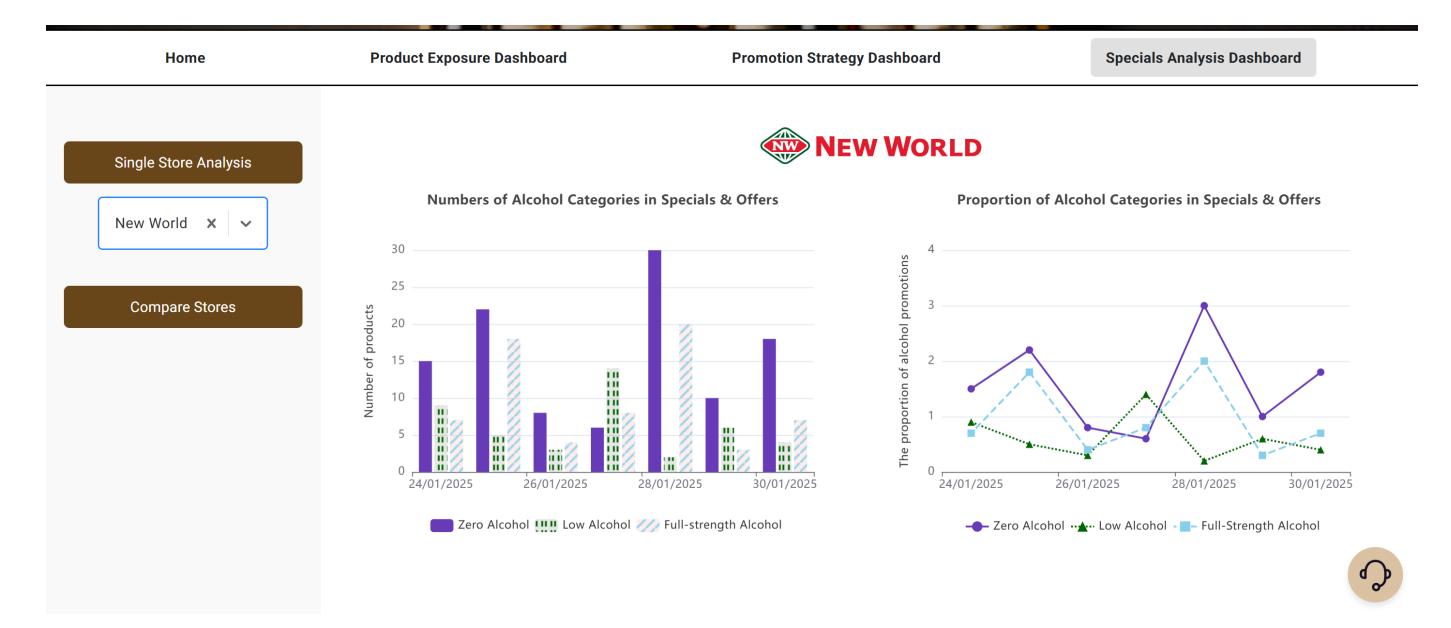
Fig. 4. This is the final view of the Specials Analysis Dashboard. Researchers can view the number and proportion of alcohol categories in retailer's special section, download the charts, select stores for comparison, or quickly navigate to desired pages using the chatbot in the bottom right corner. The chart design has been refined based on feedback from the industry mentor, using lines to distinguish between different elements and considering accessibility for colorblind users.
Furthermore, the integration of the Chatbot Assistant has optimized user navigation. By clicking the headset icon at the bottom right of the website, users can activate DrinkLens Chatbot, which offers shortcut navigation to frequently used pages, streamlining workflow and enhancing operational efficiency.
Through the implementation of these features, DrinkLens has evolved into a powerful, user-friendly, and data-driven tool that facilitates efficient alcohol market monitoring and regulatory analysis, ultimately enabling stakeholders to make more informed decisions.
VI. TECH HIGHLIGHTS
This section includes introductions and discussions of my two main contributions to the DrinkLens project, data engineering and project deployment.
A. Data Engineering
Automated data extraction for DrinkLens is implemented by Playwright, an open source browser automation tool from Microsoft. It supports multiple browsers, including Google Chrome, Mozilla Firefox, and Microsoft Edge. Playwright allows developers to automate user interactions in the browser, such as clicking buttons, filling out forms, and scrolling pages, as well as capturing page content and performing web actions. By automating web interactions and extracting content from web pages, Playwright enabled the system to retrieve relevant data from retailer websites in real time, which was then stored in the database for subsequent analysis.
For different retailers' websites, each step of the data scraping process often varies significantly, requiring continuous adjustments, optimizations, and even redesigns to accommodate different page structures and anti-scraping mechanisms. This
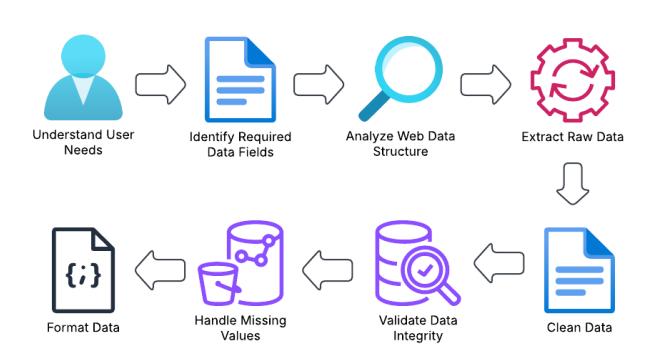
Fig. 5. This diagram illustrates the overall process followed in the DrinkLens project for data handling. It starts with understanding user needs, followed by identifying the required data fields and analyzing the web data structure. Raw data is then extracted, formatted, and processed, and is ultimately output in JSON format.
means that personalized, multi-round iterations and rigorous testing are necessary for each retailer to ensure the accuracy and stability of the data scraper. However, for the retailers studied by DrinkLens, there is still a general data handling process.
First, it is essential to clarify all necessary data fields based on user requirements. This step must be considered in parallel with database design, as the collected data will eventually be stored in the database. When selecting data fields, the principle of "better to have more than less" should be followed. The reason is that if new fields are added to the database design but are not collected or cannot be derived from existing data fields, modifications to the data collector script will be required, increasing additional development and maintenance costs. Therefore, when designing the data collection process, potential requirements should be anticipated as much as possible to reduce future adjustments and workload.
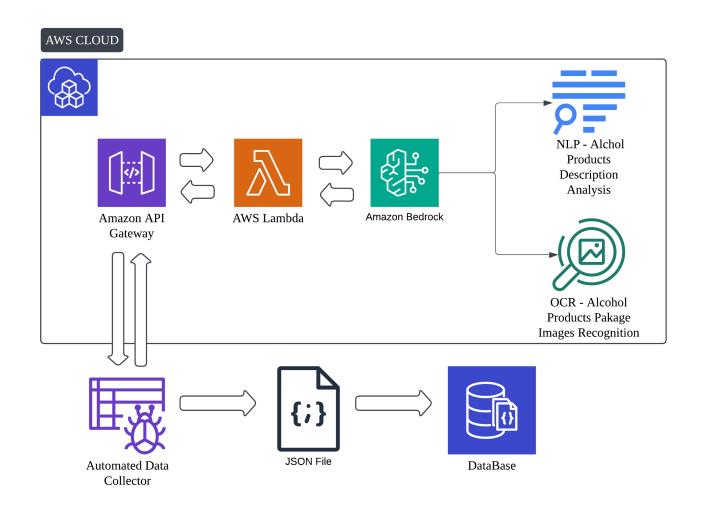
Fig. 6. This diagram presents the workflow that how DrinkLens' automated data collector integrates with AWS Bedrock, AWS API Gateway and AWS Lambda to supplement missing data. The data collector fetches raw product data, which is processed through AWS Bedrock. AWS Bedrock then leverages NLP to analyze product descriptions and OCR to interpret alcohol product packaging images, filling in the missing ABV values.
Prior to extracting data, a feasibility analysis must be conducted to assess whether existing tools can be used to obtain the targeted data. This step is critical as it affects the development cost, efficiency and stability of the data collector. Initially, a third-party data collection service was considered, but it was found to be costly and inferior to self-developed scripts in terms of success rate and customization capabilities. As a result, this option was abandoned in favor of looking into self-developed scripts.
Initially, I attempted to use Python Requests library to construct requests and retrieve web data. However, for modern websites that rely on JavaScript for dynamic rendering, this approach proved to be far more complex than anticipated. Successfully extracting data from such websites requires indepth analysis of the rendering process and the construction of intricate request payloads, making it both time-consuming and costly to maintain. Ultimately, we opted for a browser automation tool to simulate webpage rendering and directly obtain the fully rendered DOM from retailer websites. After evaluating leading browser automation tools, Selenium and Playwright, I found that Playwright, as a newer framework, offers superior performance and robust support for Node.js, making it the preferred choice.
Once the tool and method were determined, an in-depth analysis of the webpage's DOM structure was conducted to ensure the accurate extraction of target data fields and the selection of efficient algorithms for processing the data. For example, to determine whether a product is on promotion, multiple approaches can be taken, one of these is Comparing the original price and current price to identify discount information, while another is Identifying "discount" image labels or promotional markers on the product image. In practice, the most efficient and convenient method should be selected.
During the data extraction stage, XPath or CSS selectors were primarily used to accurately locate webpage elements and construct action chain to bypass anti-scraping mechanisms, ensuring smooth navigation to target pages. Additionally, a reasonable pagination strategy was established. Since most online retailer websites contain product listing pages, it was necessary to iterate through elements on listing pages and navigate to product detail pages to ensure the complete retrieval of all product detail information.
After completing page navigation, regular expressions were used to precisely parse webpage content and efficiently extract raw data. Following data extraction, string operations were performed to clean and transform raw data into specific formats, ensuring data standardization and consistency. Additionally, conditional logic mechanisms were introduced to detect and handle empty or missing values, preventing abnormal data from disrupting processing and ensuring the integrity and reliability of extracted data. Finally, the processed data was formatted into JSON files for database writing. At this stage, the initial data collection script had been completed, but several issues remained that could affect the stability and quality of data collection. These issues included network instability causing script execution interruptions, access frequency limits from retailer websites leading to IP bans, and the absence of ABV data for some products, which could impact data completeness. Corresponding optimization strategies were implemented to address these challenges.
To address network instability, a P-Retry mechanism was introduced to enable automatic retries. For instance, in some cases, webpage elements might not have fully loaded when a selector query is executed, causing the script to fail. In such scenarios, the script automatically retries within a preset maximum retry count. Each failed request is logged in detail for subsequent analysis and optimization.
On the other hand, to reduce the risk of triggering rate limiting mechanisms on retailer servers due to excessive access frequency, delayed execution was introduced between requests in the data collector, preventing frequent requests from leading to IP bans.
To resolve the issue of missing ABV data for some products, a more advanced solution was implemented. Since certain retailers do not provide structured alcohol content information on product detail pages, the DrinkLens data collector integrated AWS Bedrock services and leveraged NLP and Optical Character Recognition (OCR) technologies to intelligent supplement ABV data.For textual descriptions that may contain alcohol content information, AWS Bedrock's NLP model was used to automatically parse and extract key numerical values;for cases where ABV data was only displayed within product images, OCR technology was used to extract relevant text from images and convert it into usable data.
Finally, the scheduler is used to trigger tasks on a daily basis, executing multiple independent scripts, each responsible for retrieving information from different data sources. For example, one script specifically collects all alcoholic product information from Retailer A's alcohol section, while another script extracts all alcoholic products from Retailer B's special offers section.
B. Project Deployment
In DrinkLens, cloud deployment has always been one of my goals. Initially, the entire deployment process relied entirely on manual operations: first connecting to an AWS EC2 instance, then logging in via SSH to install the necessary dependencies (such as Git, Node.js, etc.). Every time the code was updated, it was necessary to manually log into the linux server, execute commands to pull the latest code, and restart the application. If the project involved environment variables (such as API keys, database connection information, etc.), it was also necessary to manually modify the .env file and reload it. This manual deployment approach was not only time-consuming and error-prone, but also had slow response times for code change. This was especially problematic when team members frequently submitted updates, as repeatedly executing these steps greatly impacted development efficiency.
To address these issues, GitHub Action was introduced to implement automated deployment. Whenever a push or merge occurs on the main branch, the deployment process is automatically triggered. By writing the GitHub Action workflow in the code repository, the latest code can be automatically pulled and run, ensuring the automation and efficiency of the deployment process. At the same time, GitHub Secrets were used to securely store sensitive information, such as the EC2 instance IP address, database connection information, SSH keys, etc., effectively improving security.
Additionally, since the frontend is deployed on an AWS S3 Bucket and the backend is deployed on an AWS EC2 instance, there were Cross-Origin Resource Sharing(CORS) issues when the frontend requested backend services. This issue was resolved by configuring the appropriate CORS rules in the API Gateway. During the testing phase of the project, there was an issue with high disk load on the EC2 server, which forced an upgrade to a higher-performance instance. However, changing instances typically results in changes to the public IP address, which could affect external API calls. To resolve this, Elastic IP was used to decouple the IP address from the EC2 instance, ensuring that the public IP remains unchanged even when the instance is replaced, thus avoiding the impact of IP address changes on external API calls.
VII. DISCUSSION
A. Future Work
Although DrinkLens has implemented many practical features. It still has several things for improvement in the future. First, the account management and chatbot functionality needs to be further developed, as the account management system was not developed due to time constraints, and the chatbot currently only supports navigation and does not have the ability to interact with users on a more in-depth level.
Another key aspect of future work involves improving ABV accuracy by integrating third-party information sources. While AWS Bedrock has demonstrated a high level of completion in ABV recognition, additional validation is needed to ensure the authenticity of the data.
Additionally, the price comparison feature currently relies on exact name matching, which poses a challenge when different retailers list the same product under different names. To address this issue, AI technology should be utilized for product correlation to provide a more accurate and comprehensive price comparison system.
B. Lessons Learned
Lesson Learned 1: Extracting and structuring the required information from web data in a single pass is a relatively straightforward process. However, ensuring that the automation script runs reliably over time requires continuous validation and ongoing optimization. In practice, some edge-case anomalies only become apparent after the script has been running for an extended period. For instance, a small subset of alcohol products may lack capacity information, leading to errors in data parsing. When such issues arise, it is crucial to accurately trace the specific point of failure and implement a targeted exception-handling mechanism for these anomalies to avoid impacting the entire program.
Lesson Learned 2: Sometimes documentation proves to be more efficient than verbal communication. Comprehensive documentation can significantly reduce communication costs. For example, when configuring environment variables locally, frequent back-and-forth discussions occurred in my team regarding variable keys and values. To streamline the process, a deployment wiki was created on Confluence, detailing the latest environment variables for both development and production environments. This ensured that team members could easily access the necessary information, effectively eliminating such issues.
C. Professional Attribute Developed
Throughout the Summer Health Challenge, significant progress was made in strengthening professional skills. Communication skills were enhanced through various meetings and presentations, ensuring clear task progress updates and active participation in technical discussions to align the team. My adaptability, troubleshooting efficiency, and problem-solving skills were also improved by independently analyzing source code and reviewing official documentation. For example, despite no prior experience with data collection scripts in JavaScript or Playwright, documentation was studied to resolve issues and gain a practical understanding of how to apply these technologies effectively.
D. Theory and Knowledge Application
Throughout the DrinkLens project, various concepts and knowledge from Master of Information Technology courses were applied in system design and implementation:
- INFOSYS 722: Data Mining and Big Data The Cross-Industry Standard Process for Data Mining (CRISP-DM) model I learned in INFOSYS 722, particularly its data preparation phase, was referenced. This phase was customized and adapted to develop the DrinkLens data engineering process.
- COMPSCI 732: Software Tools and Techniques Concepts and experience from COMPSCI 732 were integrated into the project, particularly in areas such as software tools, project file structure, version control and deployment.
- COMPSCI 751: Advanced Topics in Database Systems The three-stage database design process introduced in COMPSCI 751 was strictly followed in creating DrinkLens' database. Additionally, Caching introduced in COMPSCI 751 was also incorporated to enhance DrinkLens' performance.
- INFOSYS 757: Project Management and Outsourcing Although this is a broad project management course, it provided valuable guidance for the execution of our software project. Key takeaways included time management, risk management, and the importance of considering the perspectives and well-being of team members—factors that are crucial to successful project delivery.
- INFOSYS 700: Digital Innovation The course introduced various innovative technologies, including cloud computing and generative AI, both of which were ultimately applied in DrinkLens.
E. Internship Experience Insights
During my internship, I gained valuable insights into balancing technical feasibility, available resources, and business requirements. Real-world development often necessitates prioritizing practical functionality over theoretical perfection, requiring trade-offs between limited resources, time constraints, and evolving user needs. Initially, the goals for DrinkLens were ambitious, demanding significant time and resources. However, after developing the MVP and gaining a clearer understanding of business constraints, we refined our approach. We redesign and removed some non-essential features, ensuring that the project could be delivered on time without compromising its core value.
Another key insight I gained from the internship experience is the importance of building scalable and maintainable software architectures. Through iterations of DrinkLens, I have come to realize that a well-designed architecture should be able to achieve maximum functionality updates with minimum code changes. A good software architecture should not only meet current requirements, but also have the flexibility to adapt to future changes.
VIII. CONCLUSION
Using agile software development principles and advanced technologies such as data science, NLP and cloud computing, DrinkLens, an automated tool for auditing alcohol product marketing, was successfully developed. The tool improves the efficiency of data collection and analysis of alcohol products in online retailers, providing a more efficient way to track and evaluate alcohol marketing trends. Through automated data collection and advanced analytics, DrinkLens provides insights of product exposure, promotional strategies and price comparisons, form researchers with a deeper understanding of market trends and the impact of current marketing practices.
Although this DrinkLens has been developed, there is potential for further improvements in the future. One possible improvement includes a raw data export feature that allows direct access to metadata in the visualization data. This addition will enhance data support for academic research and evidencebased decision-making.The launch of DrinkLens marks an advancement in alcohol marketing audit tools. Continued development of the system is expected to enhance its role in public health research, policy development and market regulation, thereby promoting responsible alcohol consumption and broader public health initiatives in New Zealand and beyond.
IX. ACKNOWLEDGMENT
Thanks Professor Natalie Walker and Doctor Jun Seo for their guidance and support throughout the project.
REFERENCES
- [1] J. Connor, J. Broad, J. Rehm, S. V. Hoorn, and R. Jackson, "The burden of death, disease, and disability due to alcohol in New Zealand," PubMed, vol. 118, no. 1213, p. U1412, 2005.
- [2] D. Sellman, "Ten things the alcohol industry won't tell you about alcohol," Drug and Alcohol Review, vol. 29, no. 3, pp. 301–303, Oct. 2009, doi: https://doi.org/10.1111/j.1465-3362.2009.00121.x.
- [3] D. H. Gustafson, et al., "An e-health solution for people with alcohol problems," PubMed, 2011.
- [4] K. Kypri, et al., "Web-based alcohol screening and brief intervention for Maori and non-M ¯ aori: the New Zealand e-SBINZ trials," ¯ BMC Public Health, vol. 10, no. 1, Dec. 2010, doi: https://doi.org/10.1186/ 1471-2458-10-781.
- [5] Nabeel A. Y. Al-Qirim, "Tele-Medicine: Building Knowledge-Based Tele-Health Capability in New Zealand," IGI Global eBooks, pp. 1209–1221, May 2011, doi: https://doi.org/10.4018/978-1-60566-050-9. ch091.
- [6] F. Mirza, Mobile Health Opportunities in New Zealand, 2013.
- [7] D. Parry, et al., "Building an educated health informatics workforce–the New Zealand experience," PubMed, vol. 188, pp. 86–90, Jan. 2013.
- [8] G. Dobbie and K. Ross, "Precision Driven Health: A New Zealand Research Partnership," International Journal of Integrated Care, vol. 17, no. 3, p. 32, Jul. 2017, doi: https://doi.org/10.5334/ijic.3144.
- [10] Wikipedia Contributors, "Systems development life cycle," Wikipedia, Feb. 11, 2019. https://en.wikipedia.org/wiki/Systems development life cycle.
- [11] Wikipedia Contributors, "Agile software development," Wikipedia, Dec. 04, 2018. https://en.wikipedia.org/wiki/Agile software development.
- [12] K. Flaherty, R. Hack, and A. Pacheco, "Comparative Clouds," Revista Tecnolog´ıa en Marcha, Nov. 2020, doi: https://doi.org/10.18845/tm. v33i7.5490.
Declaration of Originality
This report is my own unaided work and was not copied from nor written in collaboration with any other person.
Name: Dunyu Yang